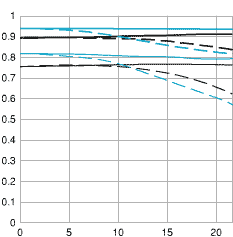
How to read MTF chart ?
MTF charts (short for Modulation Transfer Function) provide a graph analyzing a lens' ability to resolve sharp details in very fine sets of parallel lines, and a lens's contrast or ability to provide a sharp transfer between light and dark areas in sets of thicker parallel lines. Fine repeating line sets are created parallel to a diagonal line running from corner to corner of the 35mm frame, directly through the exact center of the image area. These are called sagittal lines, sometimes designated "S" on Canon's MTF charts. At a 90° angle to these, additional sets of repeating lines are drawn, called Meridional (or "M" line sets. Repeating extremely fine short parallel lines spaced at 30 lines per millimeter measure the lens' ability to record fine details, or its resolution. Even more important in the eyes of many optical designers is the lens’ contrast capability, which is measured with thicker sets of parallel repeating lines drawn at 10 lines per millimeter. At first glance, it would appear that any good lens would record lines running parallel to a diagonal drawn across the film with the same accuracy as lines drawn perpendicular to them. However, in real-world testing, this is often not the case. Especially in the Meridional direction, faithful reproduction of fine line sets becomes increasingly difficult as you move away from the center of the image toward one of the corners. And it's a fact that almost all lenses produce sharper results in general near the center of the frame than at the outer edges. MTF charts display the lens' performance from center to corner. Running along the chart's horizontal axis, labeled 0 to over 20, is the distance from the dead center ("0") of a 35mm image along a diagonal line to the corner of the frame, which is about 21.5mm away. On the chart's vertical axis is a scale representing the degree of accuracy with which the fine and coarse line sets are reproduced, in both the sagittal (parallel to the diagonal of the film format) and meridonal directions.
 Solid lines on the MTF charts indicate the performance of sagittal lines (parallel to the diagonal of the film), dashed lines are for the perpendicular meridional test target lines. In theory, a perfect lens would produce nothing but straight horizontal lines across the very top of an MTF chart, indicating 100% accurate reproduction from the center of the picture (toward the left of the chart) to its outermost corners (at the right side of the chart). Of course, no such thing as a perfect lens exists from any SLR manufacturer, so MTF charts typically show lines that tend to curve downward as they move left to right (tracking the lens' performance from center to corner of the frame). Canon's MTF charts give results at two apertures: wide-open, and stopped down to f/8, with the lens set to infinity focus. While MTF charts don't include many factors that can be important when selecting a lens (size, cost, handling, closest focusing distances, AF speed, linear distortion, evenness of illumination, and of course features like Image Stabilization which may produce superior real-world results), they can indicate to the knowledgeable reviewer some of the optical characteristics they can expect from a particular lens.
adopted from http://www.canon.com.hk
No comments:
Post a Comment